
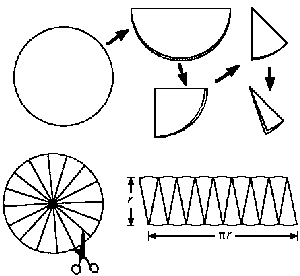
sector - section of a circle formed by 2 radii and the area of a circle connecting the 2 radii.
eg.
 Pets of students in Mr. W's class (24students)
1. What is the tittle?
2. What are the different categories represented by graph?
3. What percent of the class has a dog? and how many students have a dog?
4. % of class with cat? how many students have a cat?
5. What % of the circle is represented by all the sectors?
6. Would this graph make sense if the title or a sector labels were missing?
Video:
http://www.youtube.com/watch?v=jFg-e51Rhv4
Link:
http://socrates.bmcc.cuny.edu/cpe/circle_pie.html
Hope this helps!
thanks.


![<!--[if !vml]--><!--[endif]--> <!--[if !vml]--><!--[endif]-->](https://blogger.googleusercontent.com/img/b/R29vZ2xl/AVvXsEikhJnNY8WBaMTlX0i7rKQbzmJtl350V4SE7ednkI8jKkDEBH-n7CYhkO7OAgBxPnVGLd8hXMNvlm-ly-dsjI_mOardIWuQwKwhGW3SaPbS1RcSyhVa_KF5HTWJNtN0FD5OmuILyO6M1duY/s1600-h/math+thing.bmp)